Circa 23 March 2020
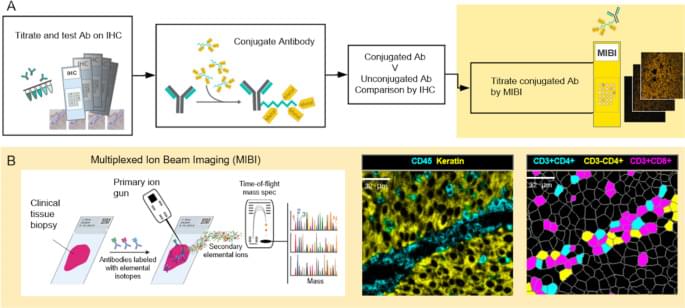
The ways in which a neoplastic cell arises and evades the immune system is the result of a departure from the systems biology that governs health. Understanding this biology requires methods that can resolve the heterogeneity of cell types, determine their states, whether they are activated (e.g., HLA-DR high) or suppressed (e.g., PD-1 high), and map their relationships or distances to one another. MIBI provides single cell resolution and sensitivity to phenotypically characterize the complex tissue environments including the TME. Executed similarly to IHC yet with the capability to profile 40+ markers simultaneously, MIBI is broadly applicable to a wide range of analyses performed in anatomic pathology including cell classification, spatial characterization, and assessment of marker expression. The MIBIscope produces data (multilayer TIFF files) that can be accessed by many analysis platforms currently available, such as those found in commercial software packages such as Fiji, Halo, and VisioPharm or freely available bioinformatic packages developed with open-source programming languages (e.g., R, Python).
All tumor types were stained, imaged, and analyzed using a single staining panel and standardized protocol. The workflow is flexible such that slides can be stained in batches and stored until imaged on the MIBIscope. Stained slides are typically stored under vacuum but protection from light is not necessary as the labels are stable metal isotopes rather than light-sensitive fluorophores. Once imaged it is possible to reimage the tissue as only a modest depth of the tissue is sputtered and analyzed during a single acquisition [16]. One limitation of the current project performed with an earlier version of the MIBIScope is the relatively small FOV size (500 μm by 500 μm) needed for images with 0.5 µm resolution. The current MIBIScope enables FOVs of 800 μm by 800 μm to be imaged in 70 min at fine resolution (650 nm). The resolution can be controlled at the instrument and acquisition at a slightly lower resolution than used in this study (1 μm) can be performed in 17 min. The 800 μm FOV captures 82% of a 1 mm TMA core. FOVs across cores of a TMA can be selected and then imaged in a single run. For whole sections it is possible to acquire adjacent images and stitch the images together using techniques commonly performed with other imaging technologies [22]. The need for tiling is particularly acute for imaging brain sections where multiple FOVs are collected to generate a larger image. Together with researchers at Stanford University, we are currently developing tiling methods to map large regions of brain tissue which will be described in a future publication. Because MIBI is still an early technology, the underlying methods for each stage of the processing pipeline are constantly evolving and improving, not just for accuracy but for generality. While the methods themselves are evolving, the pipeline tasks, at a high level, such as mass calibration, filtering, etc., are defined and have been automated through the MIBI/O software, and, as importantly, allows for appropriate user input when necessary. As more data becomes available, and the user base of MIBI grows, data processing should become more standardized.
The immediate utility of MIBI will be for understanding the biological mechanisms present in disease microenvironments. The results demonstrate the ability to detect a range of marker expression across many tumor types. The images can be segmented to define cell boundaries and then the expression of phenotypic markers used to classify cell instances into their cell class, such as proliferating tumor cells or nonproliferating tumor cells and various immune cells. Additional markers have been used on other sample sets to further define myeloid cell subsets, B cell subsets and stromal elements including vascular endothelial cells. This study also demonstrated the possibilities for calculating distances between different cell subsets including tumor and immune cells in addition to PD-1 and PD-L1 expressing immune cell subsets.
