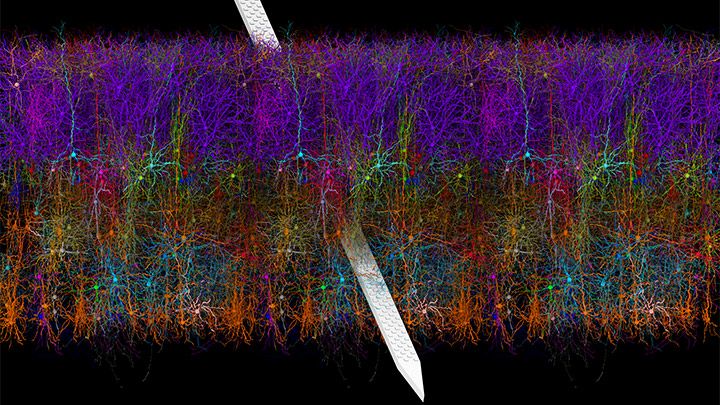
The NIH-led Brain Research through Advancing Innovative Neurotechnologies® (BRAIN) Initiative continues to teach us about the world’s most sophisticated computer: the human brain. This striking image offers a spectacular case in point, thanks to a new tool called Visual Neuronal Dynamics (VND).
VND is not a camera. It is a powerful software program that can display, animate, and analyze models of neurons and their connections, or networks, using 3D graphics. What you’re seeing in this colorful image is a strip of mouse primary visual cortex, the area in the brain where incoming sensory information gets processed into vision.
This strip contains more than 230,000 neurons of 17 different cell types. Long and spindly excitatory neurons that point upward (purple, blue, red, orange) are intermingled with short and stubby inhibitory neurons (green, cyan, magenta). Slicing through the neuronal landscape is a neuropixels probe (silver): a tiny flexible silicon detector that can record brain activity in awake animals [1].
