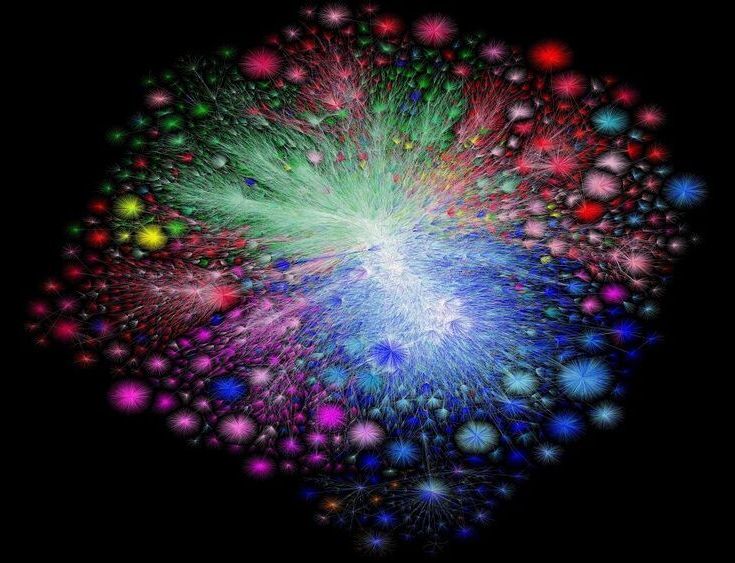
In 2003, Lyon was just finishing school and working as a hired hacker. Companies tasked him with rooting out vulnerabilities in their systems, and he’d developed mapping tools for the job. His electronic sniffers would trace a network’s lines and nodes and report back what they found. Why not set them loose on the mother of all networks, he thought? So he did.
The resulting visualization recalled grand natural patterns, like networks of neurons or the large-scale structure of the universe. But it was at once more mundane and mind-boggling—representing, as it did, both a collection of mostly standard laptop and desktop computers connected to servers in run-of-the-mill office parks and an emerging technological force that was far more than the sum of it parts.
In 2010, Lyon updated his map using a new method. Instead of the traceroutes he used in 2003, which aren’t always accurate, he turned to a more precise mapping tool using route tables generated by the Border Gateway Protocol (BGP), the internet’s main system for efficiently routing information. And now, he’s back with a new map based on BGP routes from the University of Oregon’s Route Views project. Only this time the map moves: It’s a roughly 25-year time-lapse of the internet’s explosive growth.
